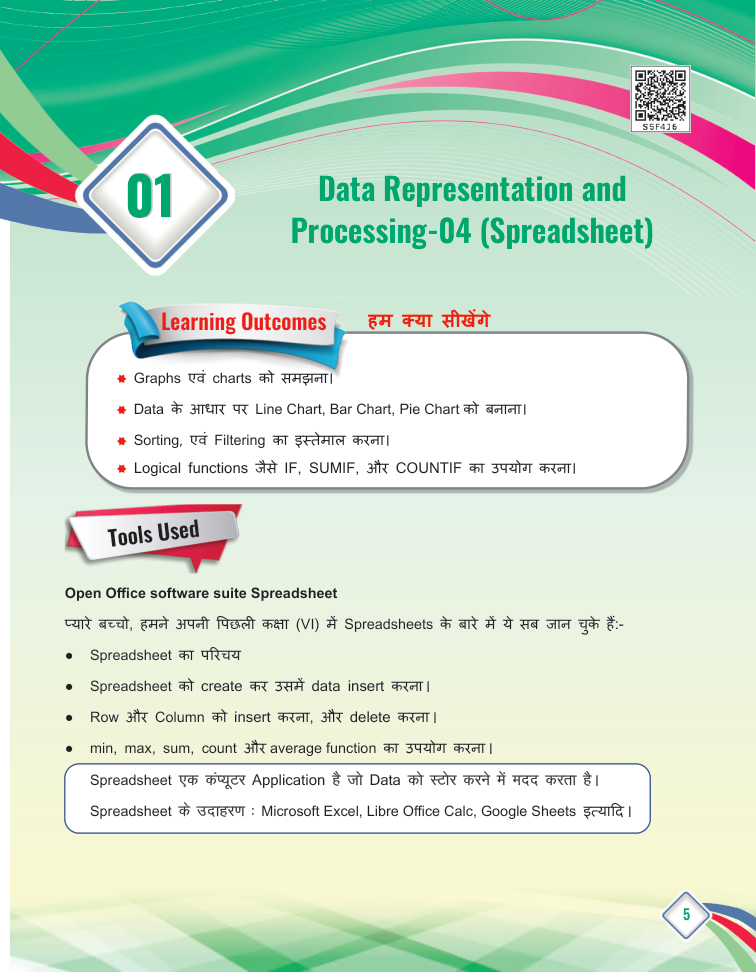
Data Representation and Processing-04 (Spreadsheet) - page from the textbook
Back to Class
1

Data Representation and Processing-04 (Spreadsheet)

5-32 • Source: SCERT Delhi ICT Textbook, Revised Edition 2026 3 Fun Facts
8 min read

The field guide

Understand it. Try it. Remember it.

Build on spreadsheet skills by asking sharper questions of larger tables. Sort to change the order, filter to focus on matching records, chart to compare patterns and use logical functions to calculate only what meets a condition.

Textbook reference: pages 5-32

01
Arrange
Select
03
Compare
Concept mapFollow the pathData Representation and Processing-04 (Spreadsheet): Arrange, Select, Compare

In this lesson

01

Spreadsheet - Recap from Class 6

Definition

Definition: A spreadsheet is a computer application that helps us store data and perform calculations on it.

Examples

  • Microsoft Excel
  • LibreOffice Calc
  • Google Sheets

Already learned in Class 6

  • Creating a spreadsheet and inserting data.
  • Inserting and deleting rows and columns.
  • Using min, max, sum, count and average functions.
02

Graphs and Charts

Definition

Definition: Data in its raw form cannot convey much information. Charts and graphs represent data visually so it becomes easy to understand.

Types of Charts (from data)

  1. 1

    Line Chart: Shows changes and trends over time, e.g. temperature across a week.

  2. 2

    Bar Chart: Compares values side by side, e.g. marks of different students.

  3. 3

    Pie Chart: Shows how parts make up a whole, e.g. how you spend your day.

03

Sorting and Filtering

  1. 1

    Sorting: Arranges data in an order - ascending (small to large, A to Z) or descending (large to small, Z to A) - making it easier to read and compare.

  2. 2

    Filtering: Shows only the rows that match a condition and hides the rest - useful with large tables.

04

Logical Functions

  1. 1

    IF: Returns one result when a condition is true and another when it is false, e.g. IF(marks>=40, "Pass", "Fail").

  2. 2

    SUMIF: Adds only the values that meet the given condition.

  3. 3

    COUNTIF: Counts only the cells that meet the given condition.

Your turn

Try a quick challenge

Create a small table of five activities and their minutes. Filter one activity and use a function to count or total matching rows.

Quick Revision

  • Chart: a visual representation of data.
  • Line Chart: shows trends over time.
  • Bar Chart: compares values.
  • Pie Chart: shows parts of a whole.
  • Sorting: arranging data in order.
  • Filtering: showing only matching rows.
  • IF/SUMIF/COUNTIF: condition-based functions.

Conclusion: Spreadsheets organise data, charts explain it visually, and logical functions help the computer take decisions for us.

Keep in mind

Quick recap

  • Sort changes order; filter hides records that do not match.
  • Charts should answer a comparison or trend question.
  • IF, SUMIF and COUNTIF apply a condition in different ways.

Key Terms

Spreadsheet

डेटा स्टोर करने वाला कंप्यूटर एप्लिकेशन

Chart

डेटा का चित्रात्मक प्रतिनिधित्व

Sorting

डेटा को क्रम में लगाना

Filtering

शर्त से मेल खाता डेटा दिखाना

IF / SUMIF / COUNTIF

शर्त-आधारित फंक्शन